

September Edition
It has returned, it has been long awaited and something of a joy to run, curate and present to those who are interested in these articles, statistics, analysis and breakdowns.
It is also very easy to understand – a weekly set of results, ranked honestly without bias and presented as it is, to determine the purest form of results, not just the accredited points.
They may seem volatile to the untrained eye – which is exactly as expected, due to this being a weekly tracking of results. There is no account of continual form – as there shouldn’t need to be.
Here is the explainer to refresh the purpose, the input and how it is created; https://hockeysteve.co.uk/2025/11/05/eihl-power-rankings-unlocked/
Unlike last season, which I let it run until the end of October to account for a minimal period in September and to analyse adjustments month to month, I decided to jump in now, as most of the Challenge Cup is out of the way and already, some clubs are reaching panic stations.
This month has seen a flurry of unexpected results, inflated form, contrasting outcomes and wild swings as teams settle in, adapt to injuries as an example, find some steady form amongst the same opponents or struggle to get by.
Regular Season
League wise in September, there have only been a few games, due to how EIHL competitions are scheduled around Arena’s.
Surprisingly, no game need more than regulation after only 6 regular season games played, split 3:2 for the home teams.
34 goals were scored in September regular season action, with 18 for the home teams. 53% overall, with the straight breakdown presenting a very lean margin of 18:16 in total.
Goals averaged would determine a winning team to hit 3.6 goals scored, so lets call it four. The losing team at 3.2, which demonstrates that tight, lean margin.
To average up, that would mean at a guess, 4:2 as a common score line. Three of the five games had margins of 3 or more goals.
Challenge Cup
It was evidently clear that for the first 10 games of the season, that swing in results, close games and unpredictability was very much present.
40% of games went to shootout, 75% of those game were won by the road team.
A total of 155 goals were scored across 25 cup games, averaging at 6.2 goals per game.
The split after the initial phase of the cup ended up at 94:61, which is easy to deduce; 3.7 goals to the winning team and 2.4 to the losers.
Round up and again it aggregates to 4:2 as a base line. Which fits the overall.
What was more noticeable, was the trend away from extra hockey, as the next set of 10 games had two OT results, the following five had one.
72% likely to finish within regulation, which is important for progression in the cup group stages. Your team need those type of wins, as it boosts their chances in case of level points at the end of that stage.
The highest win margins went to both Giants and Steelers, each starting strong, especially in the cup – of course, Giants even now, are yet to start their regular season campaign.
Ironically, both of those teams brought the only shutouts for the month, each winning 6 zip.
This is exactly how you would expect the overall September table to look.
September Rankings/Overall
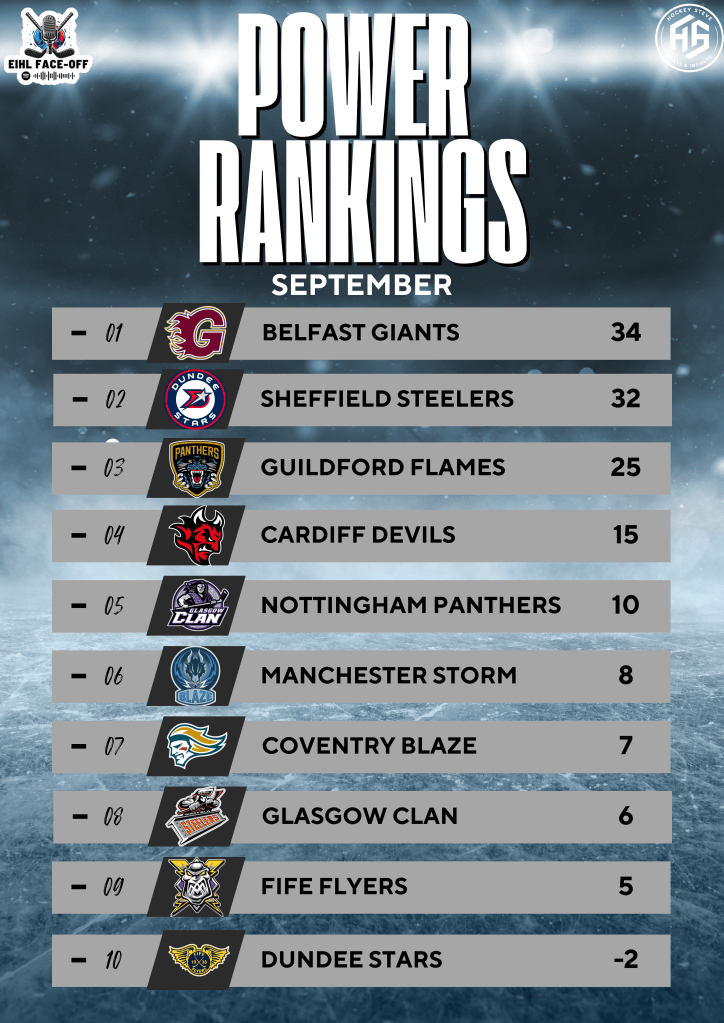
This might not come as a shock to some, considering the general results and form the Stars have ended up with, but there might be some pleasing reading for a few fans alike, such as Steelers and Clan, who currently, after GW1 in October, find their teams in less than desirable positions/outcomes.
That is hockey, that is sport.
Clan started agonisingly short of regulation wins, so naturally, they look a little inflated as a result. Of course, these positions are sure to change over time, until the form table eventually settles as the league itself starts to take shape.
Steelers for example, very closely run with Giants, who the latter have had arguably the easier start. Since the EIHL transitioned into regular season action however, Steelers have fallen flat.
By comparison to September, that is where many would have ideally had them.
However, their form rate declined even throughout that month, as results within the points system greatly offset lower scored weeks to some others.
Even Giants did, but it was still only a 3 week margin for the month, the last week of rankings was separated by 3 points from first to 7th – 8 overall across the league.
That week saw three teams tied 2nd and two teams tied 3rd – half the league apart by a single point. The placing order was then set on priority of win types.
An example, perfectly is Stars. Who reached 2nd that week. Nearly all weeks before and after have been in the minus column.
The benefits of being a lower seeded team getting a regulation win, over similar ranked teams with games settled in OT, from a low scoring game.
That is the fickleness of results and the volatility of the outcomes, as highlighted below.
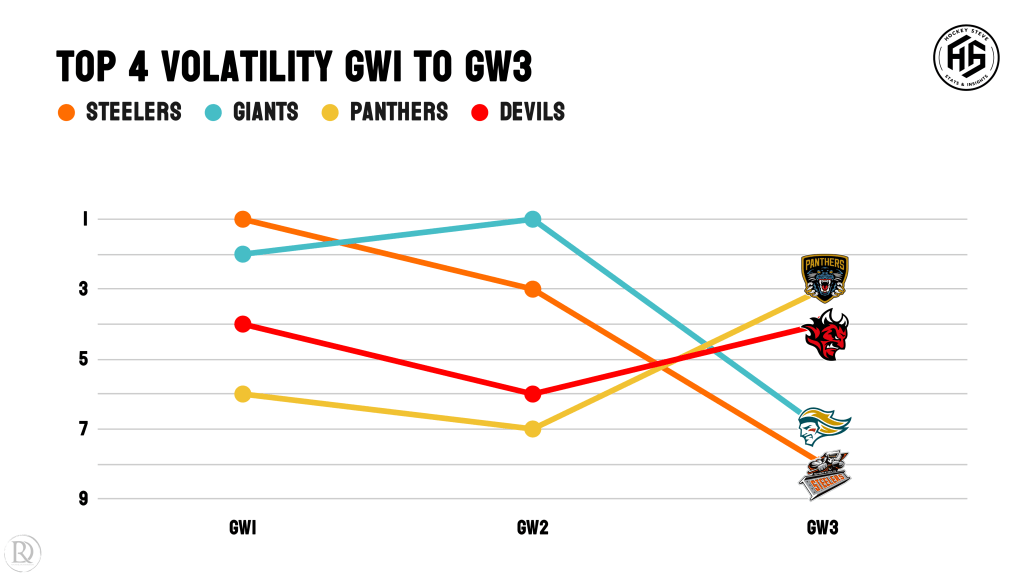
Matching up to the previous season, as referenced in the link at the beginning of the article, the only team declining was actually the Giants – both Panthers and Devils found a rebound, where as Steelers declined.
Again, three weeks of hockey and not all rankings results are even. For example, GW2 saw a gap from top to bottom of 24 points, the first week of 18 points. GW3 was 8 and not a single team hit a negative return on the scoring system.
Main Takes
Beyond the discernment of how results were made, the type of wins, losses and extent of margins by victory/defeat, there has been some early noticeable trends starting to form.
It is way too early to predict cleanly an end of season projection, as it would be heavily influenced by the stand alone rankings as it is.
For the trends within the results and systemic attribution, the distribution of points and resulting places has determined who is the most volatile, who is the most steady and which team is currently tanking.
I doubt you need to guess the latter, as Stars are the only team in the negative for overall points.
The team that was the most steady in terms of the rankings, is unsurprisingly the team going into their home DH regular season weekend, the Devils.
They played the perfect .500 hockey across September. it reflected in their rank spread, hemmed at 2 places.
The most volatile wasn’t just the Stars, who are currently tanking, they did make 2nd place.
With them, are Flames, that despite some massive victories over strong contenders for silverware (consecutively), started second bottom, then shot up the table, eventually finishing top in the shortened sample for the month.
A great, early case for positive volatility and negative volatility. The fickleness of sport.
Even though they have yet to start their regular season campaign, Giants held a slender lead during September, thanks to big wins in regulation. As far as projected standings go, the end result would only match the first months’ outcome.
Until the cup is about scrubbed off, there hasn’t yet been a true week of pure regular season action, so for now, projected rankings, form compilations and analysis relating to the league table is yet to get going, this will feature in November, as part of the October review.
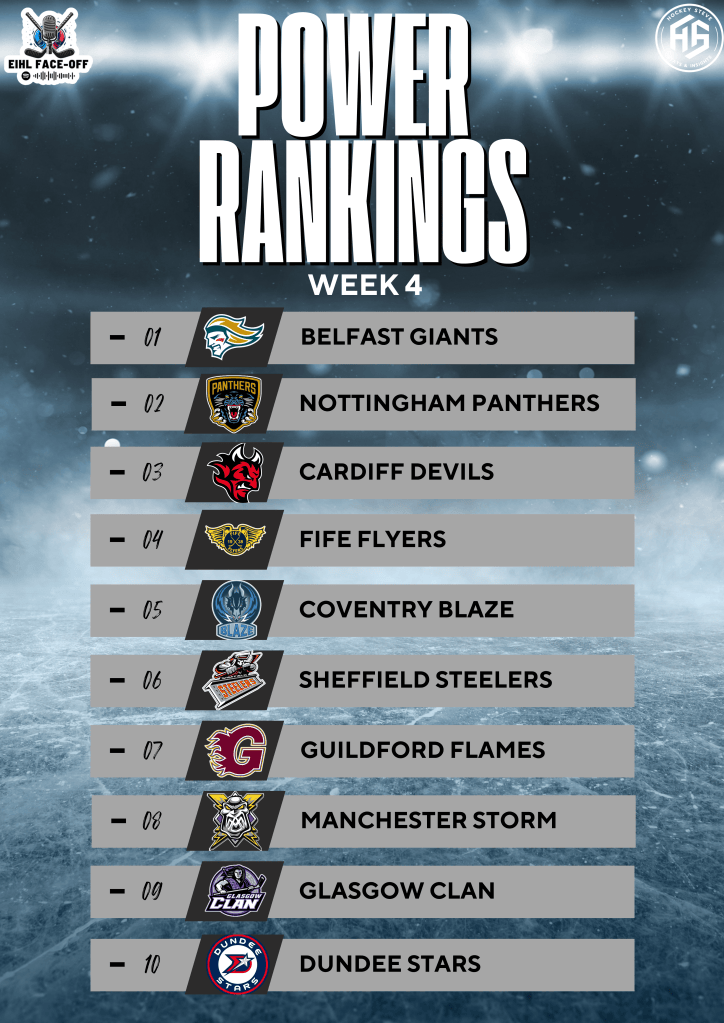
As for the most recent, here is the latest rankings, as explained on the EIHL Face-Off Podcast; showing just how energetic each week can be with how they land, based on results.


Leave a comment